One of the most fundamental distinctions in data is between qualitative and quantitative data:
Definition9.
Qualitative data (also called categorical data) represents characteristics that can be observed but not measured numerically. Qualitative data can be classified into categories.
Definition10.
Quantitative data represents information that can be measured numerically and can be used in calculations.
Example11.
Consider the following variables from our Community Health dataset:
Qualitative: Neighborhood name, zip code, predominant housing type
Quantitative: Asthma rate (%), air quality index, median household income ($), number of parks
Activity6.Identifying Data Types.
In this activity, you’ll practice identifying qualitative and quantitative data.
(a)
For the sample Community Health dataset, identify whether each variable is qualitative or quantitative:
Neighborhood
Population density
Predominant land use
Percent green space
Average temperature (°F)
Healthcare access rating
(b)
Now examine your chosen dataset and classify each variable as qualitative or quantitative.
Checkpoint12.Identifying Data Types.
Which of the following is an example of quantitative data?
Hair color
Hair color is qualitative (categorical) data as it represents a characteristic that can be categorized but not measured numerically.
Zip code
Although zip codes contain numbers, they are actually qualitative data because they represent categories (geographic regions) rather than measurements.
Height in centimeters
Correct! Height in centimeters is quantitative data because it represents a numerical measurement that can be used in calculations.
Blood type
Blood type (A, B, AB, O) is qualitative data as it represents categories rather than numerical measurements.
SubsectionMeasurement Scales
Data can be further classified by measurement scale, which affects what operations and analyses make sense for that data.
Definition13.
Nominal data represents categories with no inherent order. The only valid operation is determining equality (same or different).
Definition14.
Ordinal data represents categories with a meaningful order or ranking, but the differences between values may not be consistent or meaningful.
Definition15.
Interval data has consistent differences between values, but lacks a meaningful zero point.
Definition16.
Ratio data has consistent differences between values and a meaningful zero point (zero represents the absence of the quantity).
Example17.
Examples from our Community Health dataset:
Nominal: Neighborhood name, predominant land use (residential, commercial, industrial, mixed)
Interval: Temperature (°F or °C) - the difference between 70°F and 80°F is the same as between 80°F and 90°F, but 0°F doesn’t represent the absence of temperature
Ratio: Asthma rate (%), income ($), number of parks, population - zero means none, and the difference between values is consistent
Insight18.
Understanding measurement scales helps you determine appropriate:
In this activity, you’ll practice identifying measurement scales.
(a)
For each variable below, identify its measurement scale (nominal, ordinal, interval, or ratio):
ZIP code
Education level (no high school, high school, bachelor’s, graduate)
Annual rainfall (inches)
Birth month
Satisfaction rating (1-5 scale)
Distance from city center (miles)
(b)
Now examine your chosen dataset and classify each variable by measurement scale.
Checkpoint19.Measurement Scales.
Match each variable with its appropriate measurement scale.
Temperature in degrees Fahrenheit
Interval
Brand preference (Favorite soda brand)
Nominal
Customer satisfaction rating (1-5 stars)
Ordinal
Height in centimeters
Ratio
Academic letter grades (A, B, C, D, F)
Ordinal
Weight in kilograms
Ratio
SubsectionOther Data Classifications
Beyond the qualitative/quantitative and measurement scale distinctions, there are other useful ways to classify data:
Definition20.
Discrete data can only take specific values (usually whole numbers), while continuous data can take any value within a range.
Example21.
From our Community Health dataset:
Discrete: Number of parks, number of healthcare facilities, population count
Continuous: Air quality index, median income, percent green space, asthma rate
Definition22.
Structured data is organized in a predefined format (like a spreadsheet or database), while unstructured data doesn’t conform to a predefined data model (text, images, audio).
In this course, we’ll primarily work with structured data, but it’s important to know that unstructured data constitutes the majority of data generated today.
Checkpoint23.Data Type Review.
Which of the following statements about data types and classifications is correct?
All numerical data is quantitative and all text data is qualitative.
Not all numerical data is quantitative. For example, zip codes are numerical but are considered qualitative (nominal) data.
Nominal and ordinal scales are types of quantitative data.
Nominal and ordinal scales are actually types of qualitative (categorical) data.
Interval data has a true zero point, while ratio data does not.
This is reversed. Ratio data has a true zero point (representing the absence of the quantity), while interval data does not.
Discrete data can only take specific values, while continuous data can take any value within a range.
Correct! Discrete data is limited to specific values (usually whole numbers), while continuous data can take any value within a range, including fractional values.
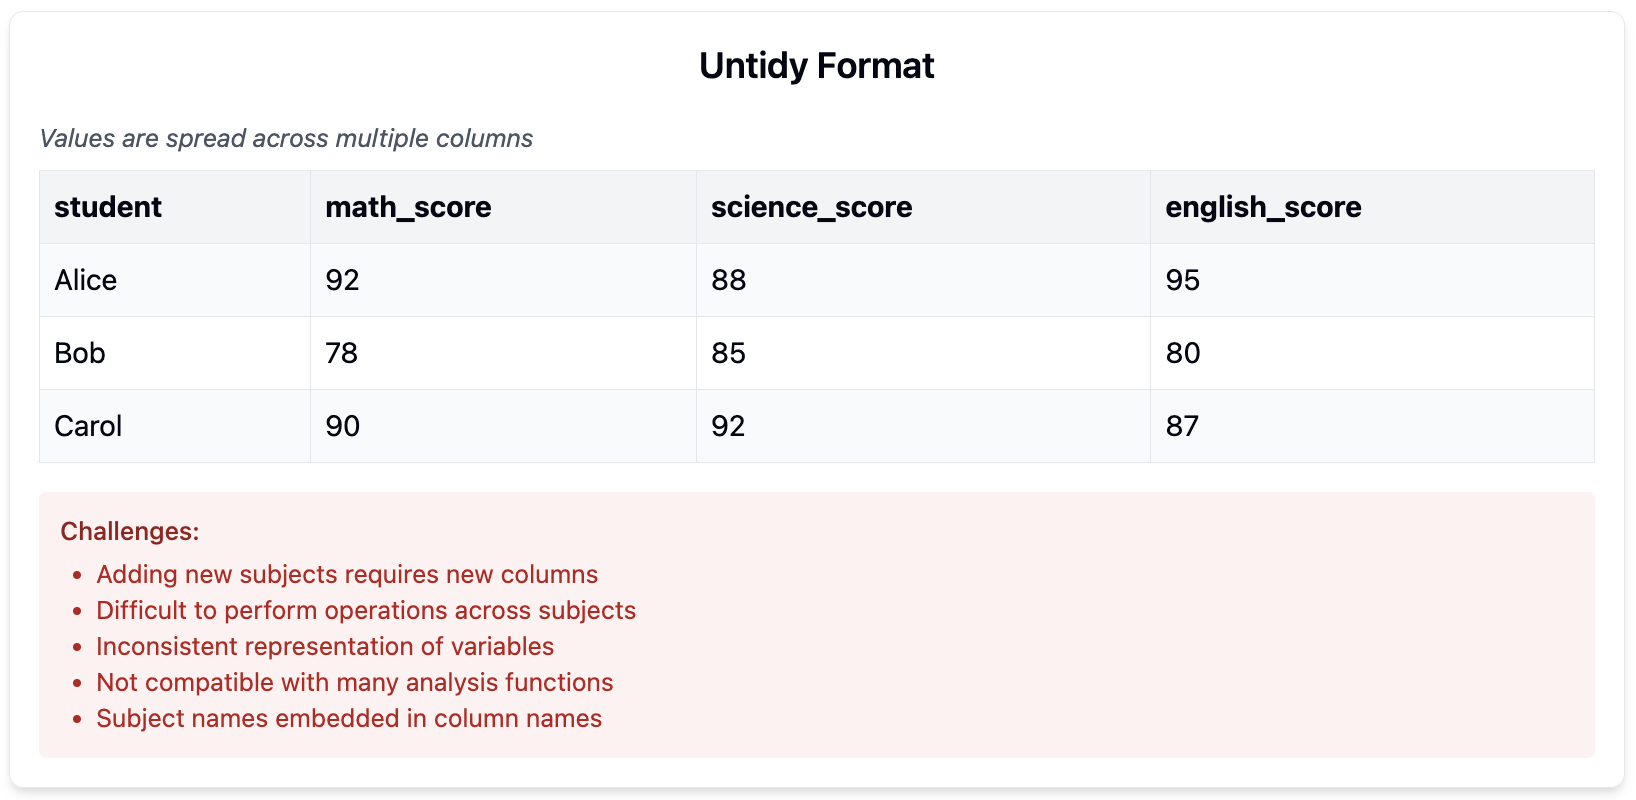
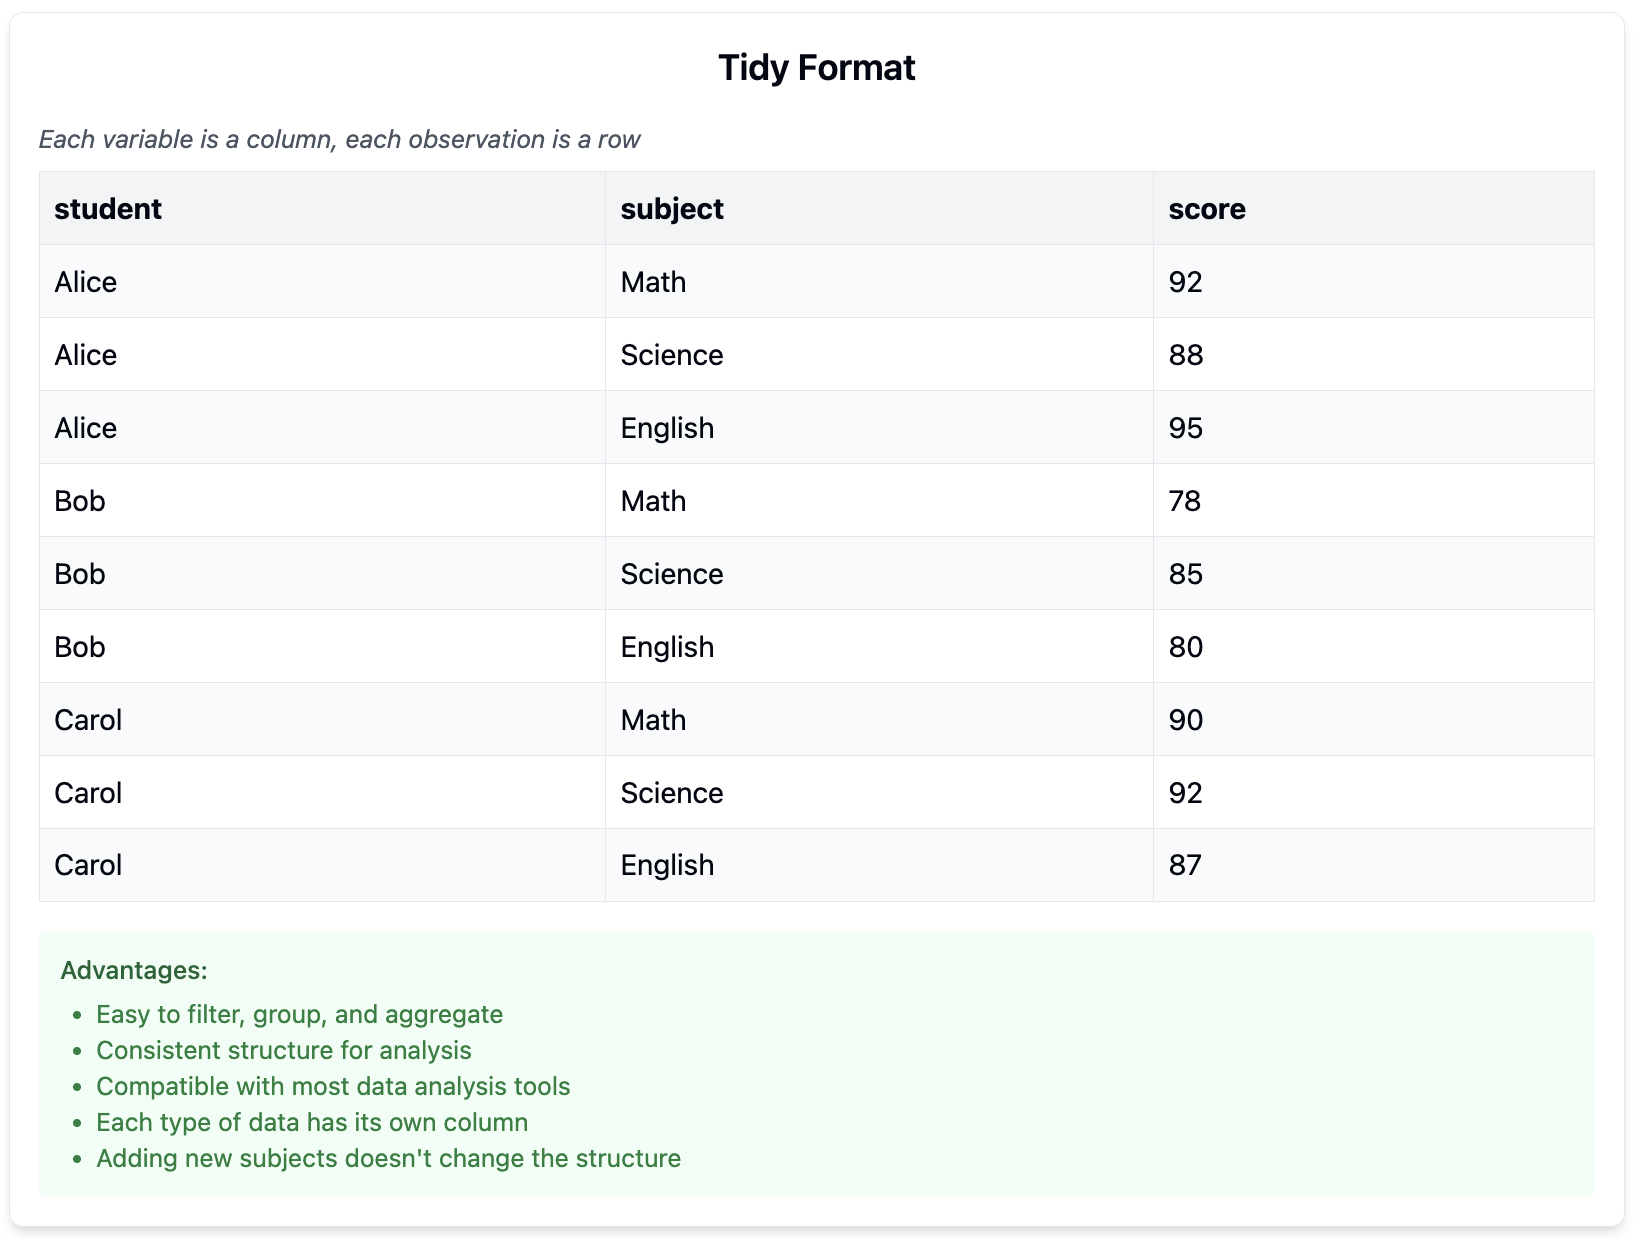
Definition24.
Tidy data is a specific way of organizing data where:
Each variable forms a column
Each observation forms a row
Each type of observational unit forms a table
Figure25.Untidy Data
Figure26.Tidy Data
Tidy data makes analysis and visualization more straightforward, as most analysis tools (including CODAP) are designed to work with data in this format.
Activity8.Identifying Tidy Data.
In this activity, you’ll practice identifying tidy and untidy data.
(a)
Examine the following datasets in CODAP:
Open a new CODAP document
Click on "Example Documents" in the main menu
Open both "Mammals" and "Speed Trap"
(b)
For each dataset, determine if it follows the principles of tidy data. If not, explain what would need to change to make it tidy.
(c)
Examine your chosen project dataset. Is it in tidy format? If not, what would need to change?