
Section Statistical Thinking: Comparing Groups

Subsection Variation Within and Between Groups

When comparing groups, it’s important to consider both the variation within each group and the variation between groups. This helps us determine whether observed differences are meaningful or might simply be due to random variation.

Definition 76.

Within-group variation refers to how much values differ from each other within the same group or category.

Definition 77.

Between-group variation refers to how much the typical values (e.g., means) differ across different groups or categories.
Two scenarios: one showing large between-group differences with small within-group variation, and another showing small between-group differences with large within-group variation.
Figure 78. Within- and Between-Group Variation
The relationship between within-group and between-group variation affects our ability to draw meaningful conclusions:
  • When between-group variation is large relative to within-group variation, group differences are more likely to be meaningful.
  • When within-group variation is large relative to between-group variation, apparent group differences might just reflect random variation.

Example 79. Variation in Community Health Data.

When comparing asthma rates across income levels in our Community Health dataset:
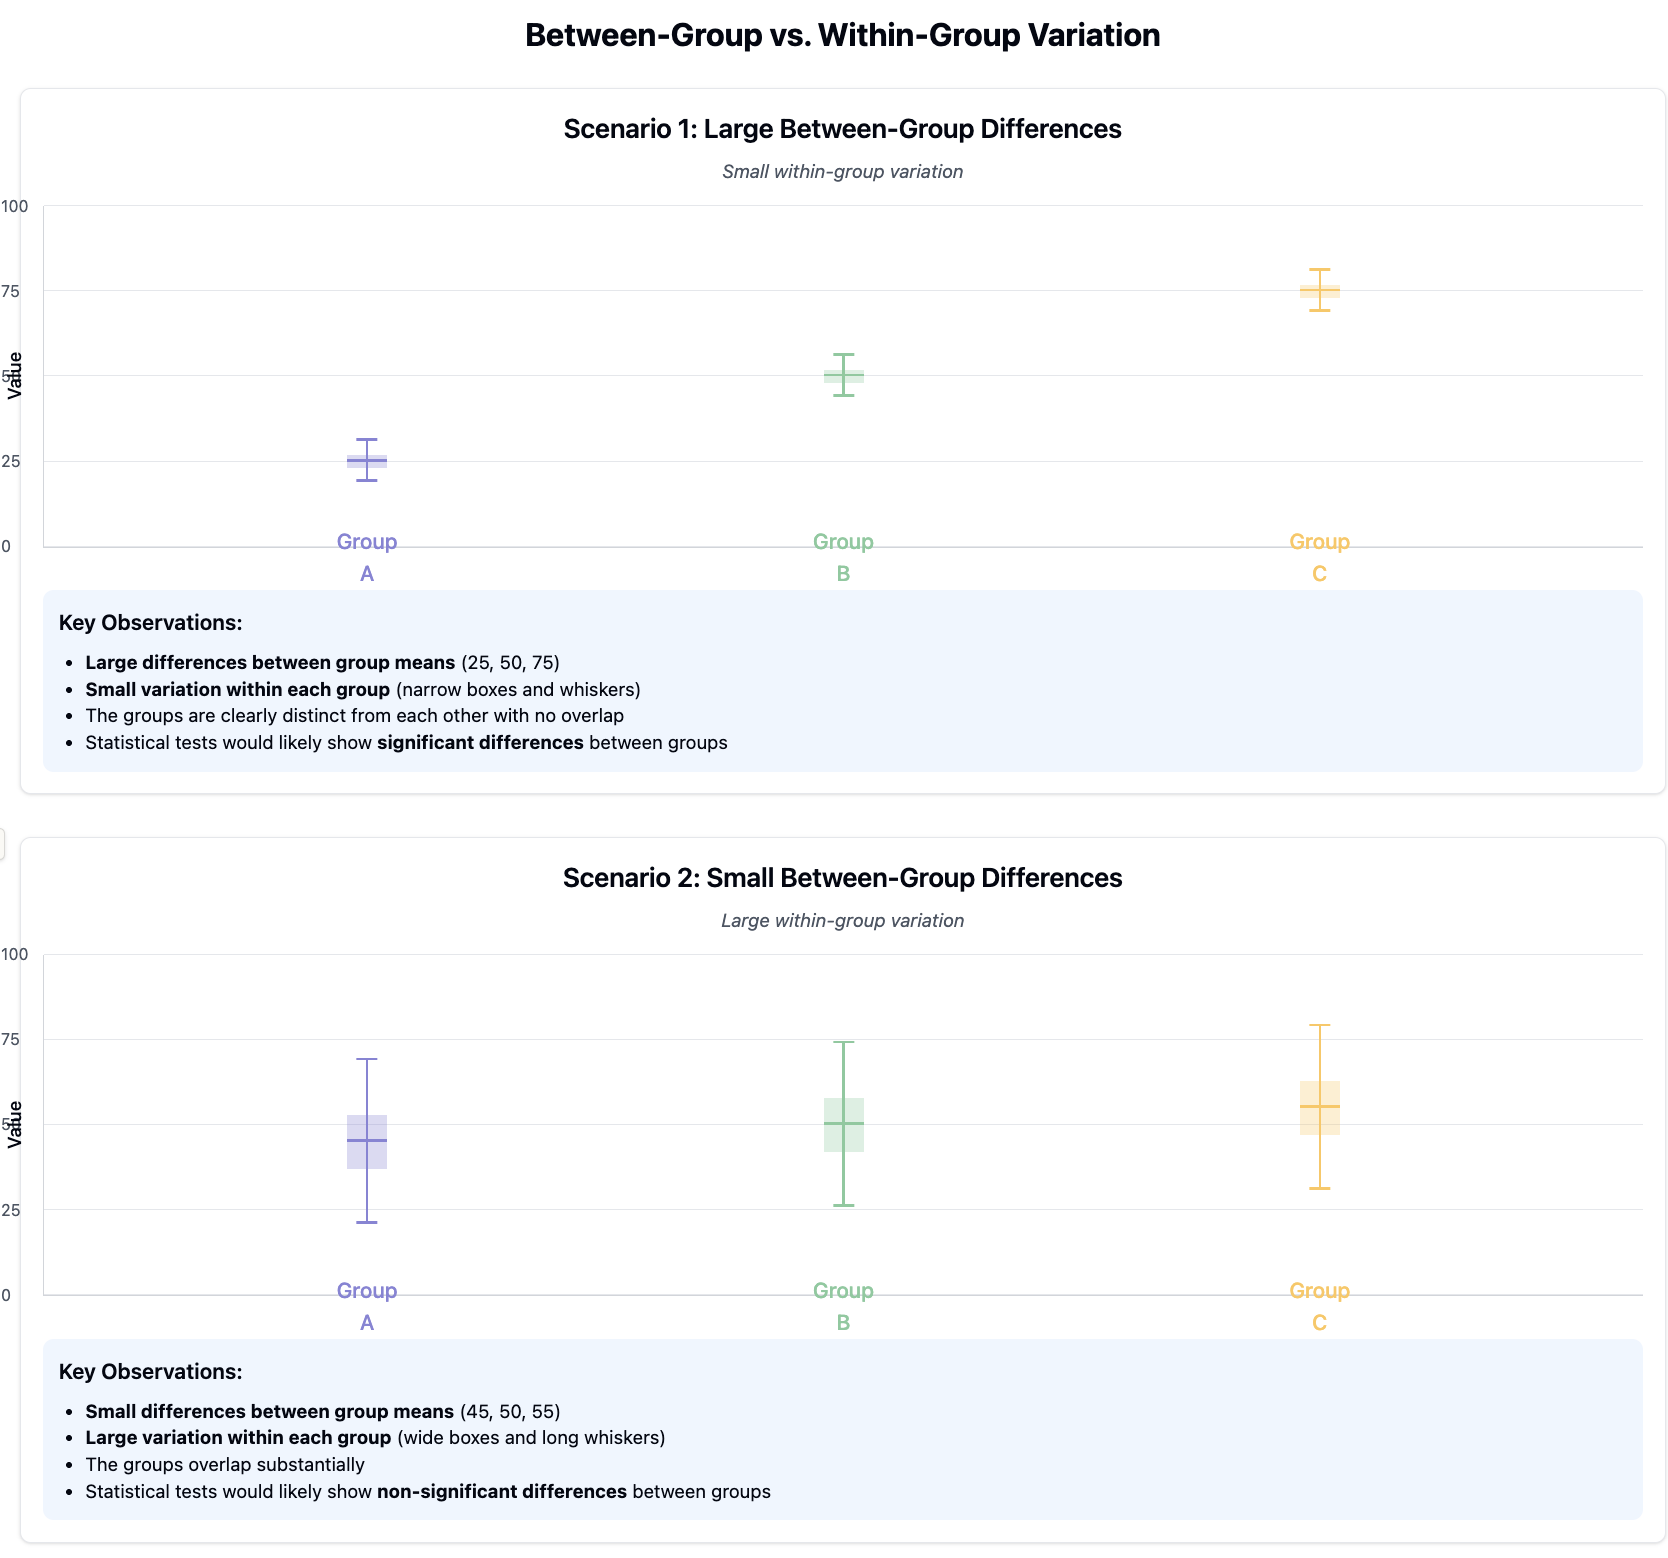
  • Within-group variation: The range of asthma rates among neighborhoods within the same income category (e.g., high-income neighborhoods might have asthma rates ranging from 5% to 12%).
  • Between-group variation: The difference in average asthma rates between income categories (e.g., high-income neighborhoods averaging 8% versus low-income neighborhoods averaging 15%).
If within-group variation is small (neighborhoods within the same income category have similar asthma rates) and between-group variation is large (different income categories have noticeably different average asthma rates), we might reasonably conclude that income level is associated with asthma prevalence.

Checkpoint 80. Comparing Group Variations.

    Based on the box plots below, which statement is most accurate?
    Two scenarios: one showing large between-group differences with small within-group variation, and another showing small between-group differences with large within-group variation.
    Method A has scores ranging from 60-80 with median 70, Method B has scores ranging from 65-85 with median 75, and Method C has scores ranging from 40-95 with median 72.
  • Method C is clearly the most effective teaching approach.
  • This is not supported by the data. While Method C has some high scores, it also has the lowest scores and the widest range, indicating inconsistent results.
  • There are no meaningful differences between the teaching methods.
  • This overlooks the notable differences in both median scores and score distributions among the methods.
  • Method B has the highest median score, but the differences between methods are modest.
  • This accurately notes Method B’s higher median but doesn’t address the important difference in variability.
  • Method B shows a higher median with relatively low variability, while Method C shows inconsistent results with high variability.
  • Correct! This statement accurately describes both the differences in central tendency (median scores) and the critical difference in within-group variation, with Method C showing much higher variability in outcomes than Methods A and B.

Subsection Making Meaningful Comparisons

To make meaningful comparisons between groups, consider these key principles:
Compare Like with Like
Ensure that groups are comparable in terms of relevant characteristics other than the one you’re studying.
Consider Sample Size
Larger groups generally provide more reliable estimates than smaller groups.
Examine Both Summary Statistics and Distributions
Don’t rely solely on averages; consider the full distribution of values within each group.
Visualize Comparisons
Use appropriate visualizations (box plots, bar charts with error bars, etc.) to show both central tendency and variation.
Test for Statistical Significance
When appropriate, use statistical tests to assess whether differences are likely due to chance.
Consider Practical Significance
Even statistically significant differences might not be practically meaningful if they’re very small.

Example 81. Meaningful Comparisons in Community Health.

To meaningfully compare asthma rates between high-income and low-income neighborhoods in our dataset, we might:
  • Control for other factors by comparing neighborhoods with similar population density, age distribution, and geographic location
  • Ensure we have enough neighborhoods in each income category for reliable comparison
  • Examine not just average asthma rates but also the range and distribution within each income group
  • Create box plots showing asthma rates by income category, clearly displaying both central tendency and variation
  • Conduct a statistical test (e.g., t-test) to assess whether the difference in means is statistically significant
  • Consider whether the observed difference in asthma rates (e.g., 7 percentage points) is large enough to be medically and socially significant

Activity 24. Comparing Groups in Your Dataset.

In this activity, you’ll practice making meaningful comparisons between groups in your dataset.
(a)
Identify a categorical variable in your dataset that creates meaningful groups for comparison. This could be a variable that was in the original dataset or a derived categorical variable you created.
(b)
Select at least two numerical variables to compare across these groups.
(c)
Create appropriate visualizations (box plots, bar charts with measures of variation, etc.) to compare the groups.
(d)
Write a brief analysis of the comparisons, addressing:
  • What differences do you observe between groups?
  • How much variation exists within each group?
  • Are the differences large enough to be meaningful in the context of your research questions?
  • What factors might explain the differences you observed?

Checkpoint 82. Group Comparison Pitfalls.

For each scenario, identify the primary issue that could lead to misleading conclusions when comparing groups.
Scenario 1: A researcher compares the performance of students who chose to participate in an optional after-school program with those who did not.
What is the primary issue in this scenario?
  • a. Inadequate sample size
  • b. Self-selection bias
  • c. Comparing unlike time periods
  • d. Using inappropriate statistical tests
Scenario 2: An analyst reports that neighborhoods with more parks have lower crime rates, suggesting that parks reduce crime.
What is the primary issue in this scenario?
  • a. Insufficient visualization of the data
  • b. High within-group variation
  • c. Confusing correlation with causation
  • d. Outlier influence
Hint.
Think about what assumptions or inferences are being made in each scenario, and whether they are supported by the data collection method or analysis.
Answer 1.
\(\text{b}\)
Answer 2.
\(\text{c}\)
Solution.
Scenario 1: The primary issue is self-selection bias.
Students who choose to participate in optional programs may already be more motivated or higher-performing than those who don’t. This self-selection bias means the groups differ in ways beyond just program participation.
Scenario 2: The primary issue is confusing correlation with causation.
The analyst observes a correlation (neighborhoods with more parks have lower crime) but suggests causation (parks reduce crime). Other factors like neighborhood wealth, housing density, or policing could explain both the presence of parks and lower crime rates.