CODAP (Common Online Data Analysis Platform) is a free, web-based data analysis tool designed specifically for educational purposes. It provides an intuitive interface for exploring data without requiring programming knowledge.
SubsectionThe CODAP Interface
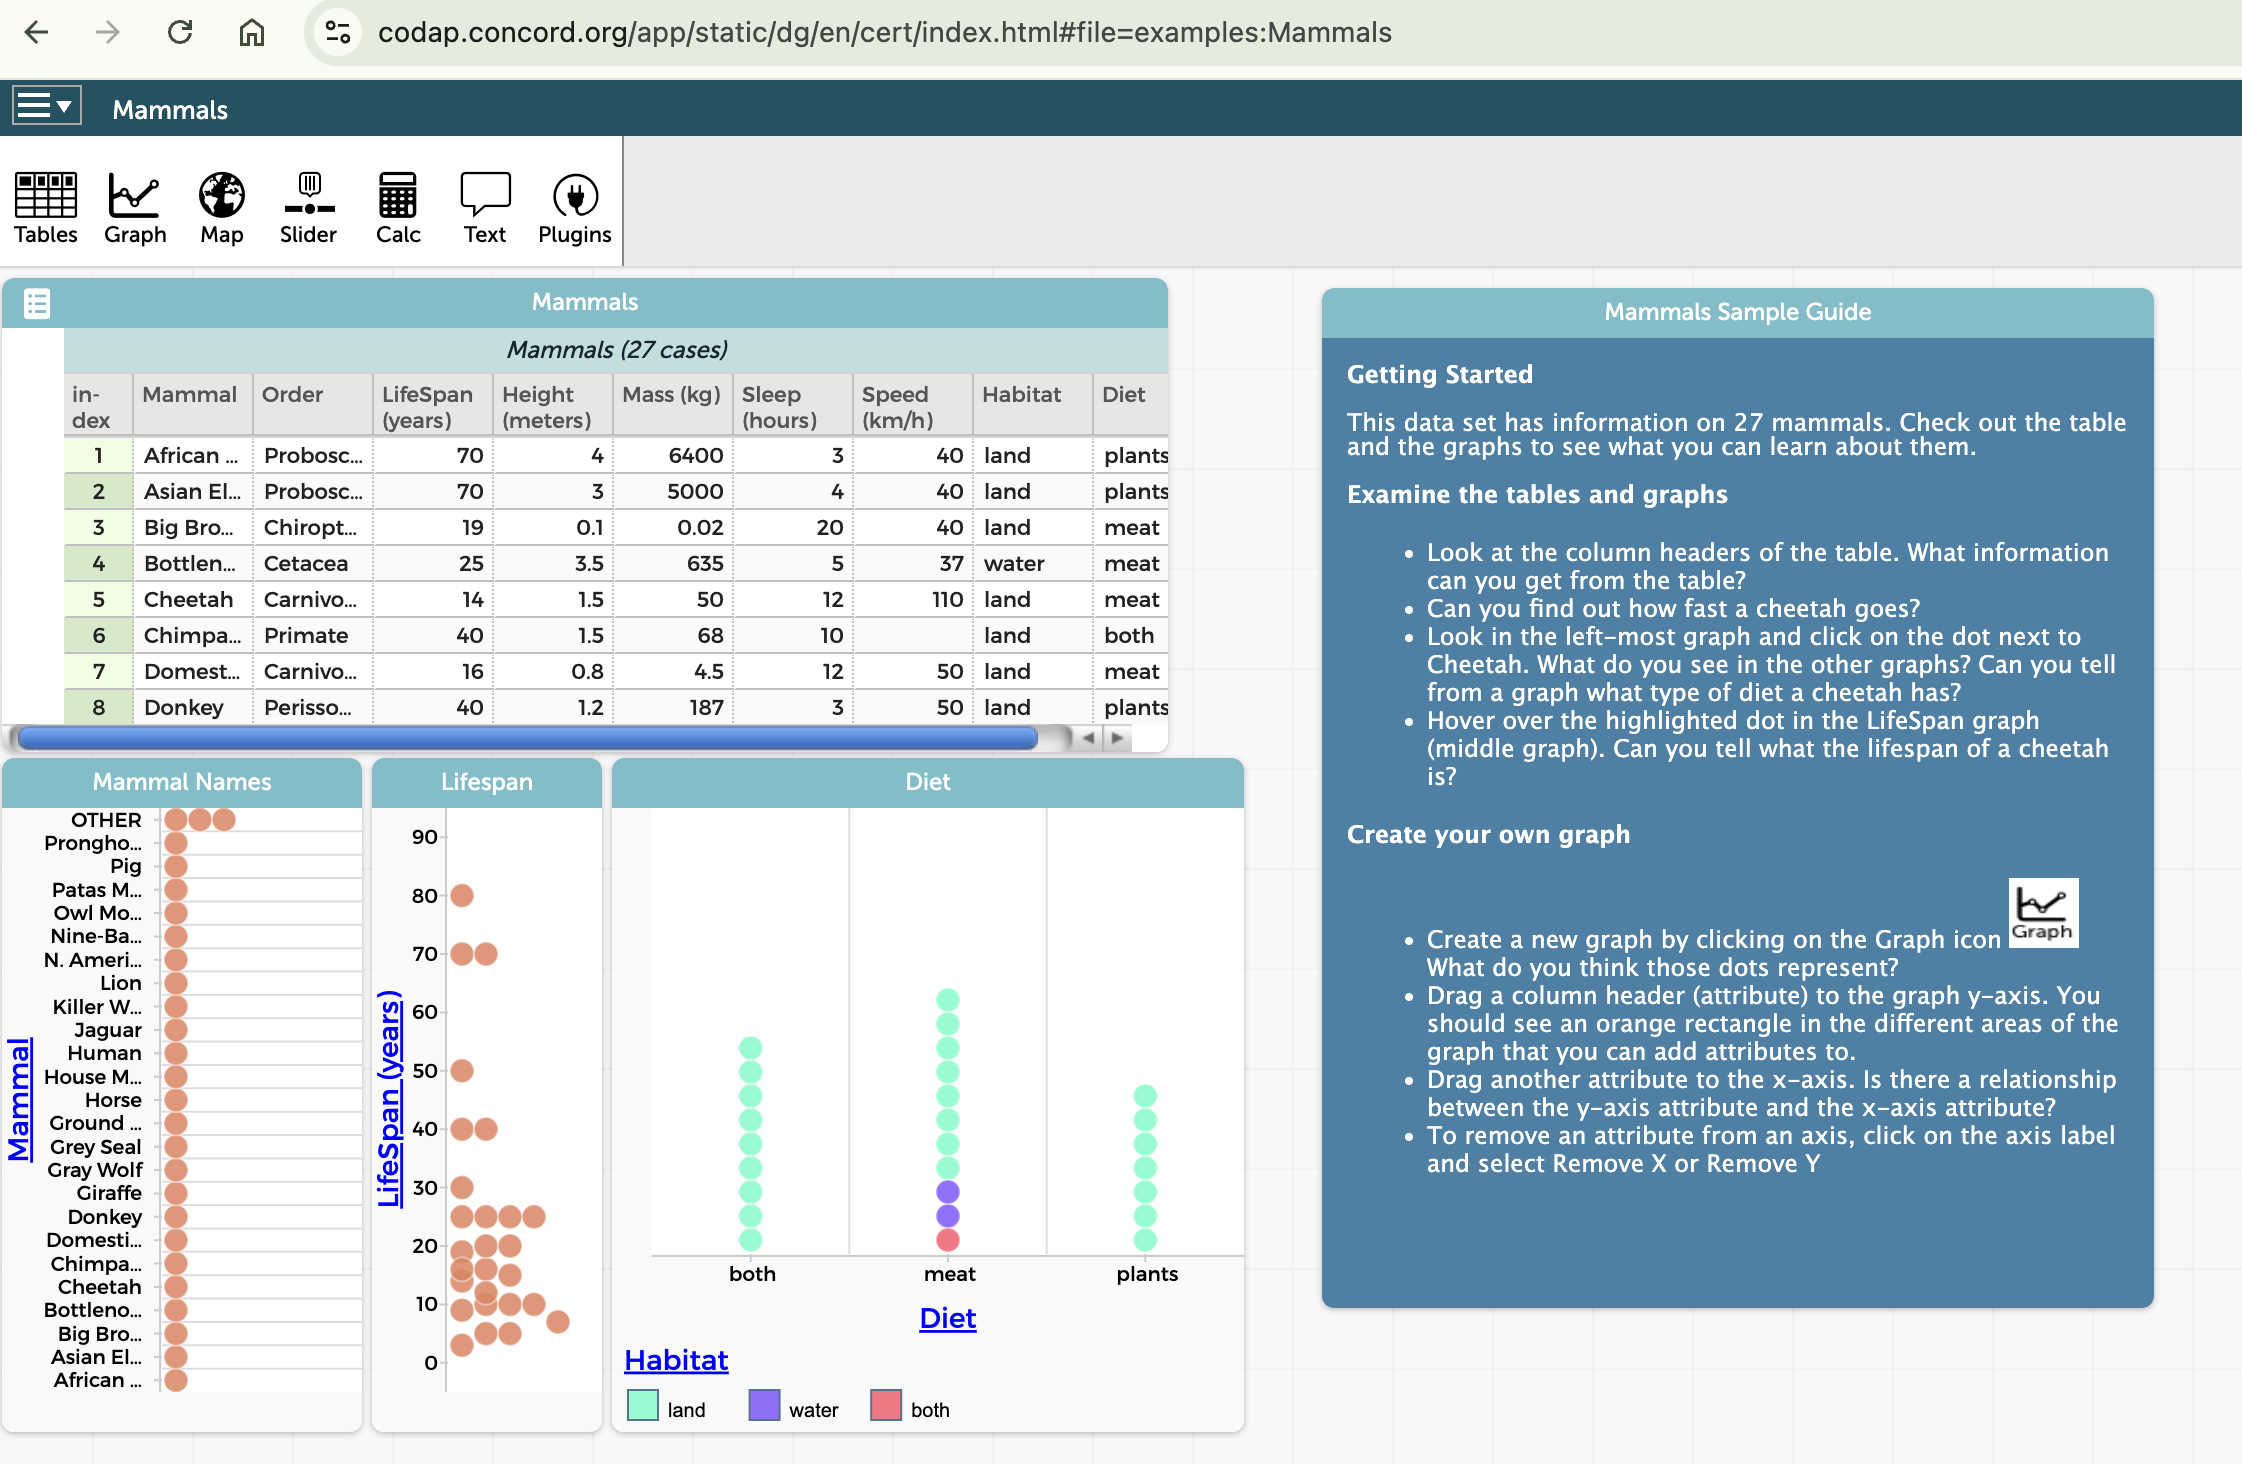
Let’s explore the basic components of the CODAP interface:
Figure6.The CODAP Interface
Key components include:
Tables: Display data in rows and columns
Graphs: Create visual representations of data
Calculator: Perform calculations and create new attributes
Click on "Examples" in the main menu and select "Mammals" from the list.
(c)
Explore the table by:
Scrolling through the data
Sorting columns by clicking on column headers
Resizing columns by dragging the column borders
(d)
Create a graph by:
Clicking on "Graph" in the main toolbar
Dragging "Body Weight" from the table to the horizontal axis
Dragging "Brain Weight" from the table to the vertical axis
(e)
Explore the relationship between body weight and brain weight by examining the graph. What patterns do you notice?
This basic exploration gives you a sense of how CODAP makes it easy to view and visualize data. Throughout this course, we’ll build on these skills to perform more sophisticated analyses.