Statistical thinking is a way of approaching problems that acknowledges and accounts for variability. Understanding variability is essential for interpreting data and making informed decisions.
Definition43.
Variability refers to the extent to which data points in a set differ from each other and from measures of central tendency. It is an inherent characteristic of data that arises from multiple sources.
Several key concepts help us understand and quantify variability:
Measures of Center
Statistics like mean, median, and mode that describe typical values in a distribution.
Measures of Spread
Statistics like range, interquartile range, variance, and standard deviation that quantify the amount of variability.
Distribution Shape
The pattern of variation in a dataset, which might be symmetric, skewed, uniform, bimodal, or follow a specific distribution like normal.
Sources of Variability
Factors that contribute to differences in observations, including natural variation, measurement error, and sampling methods.
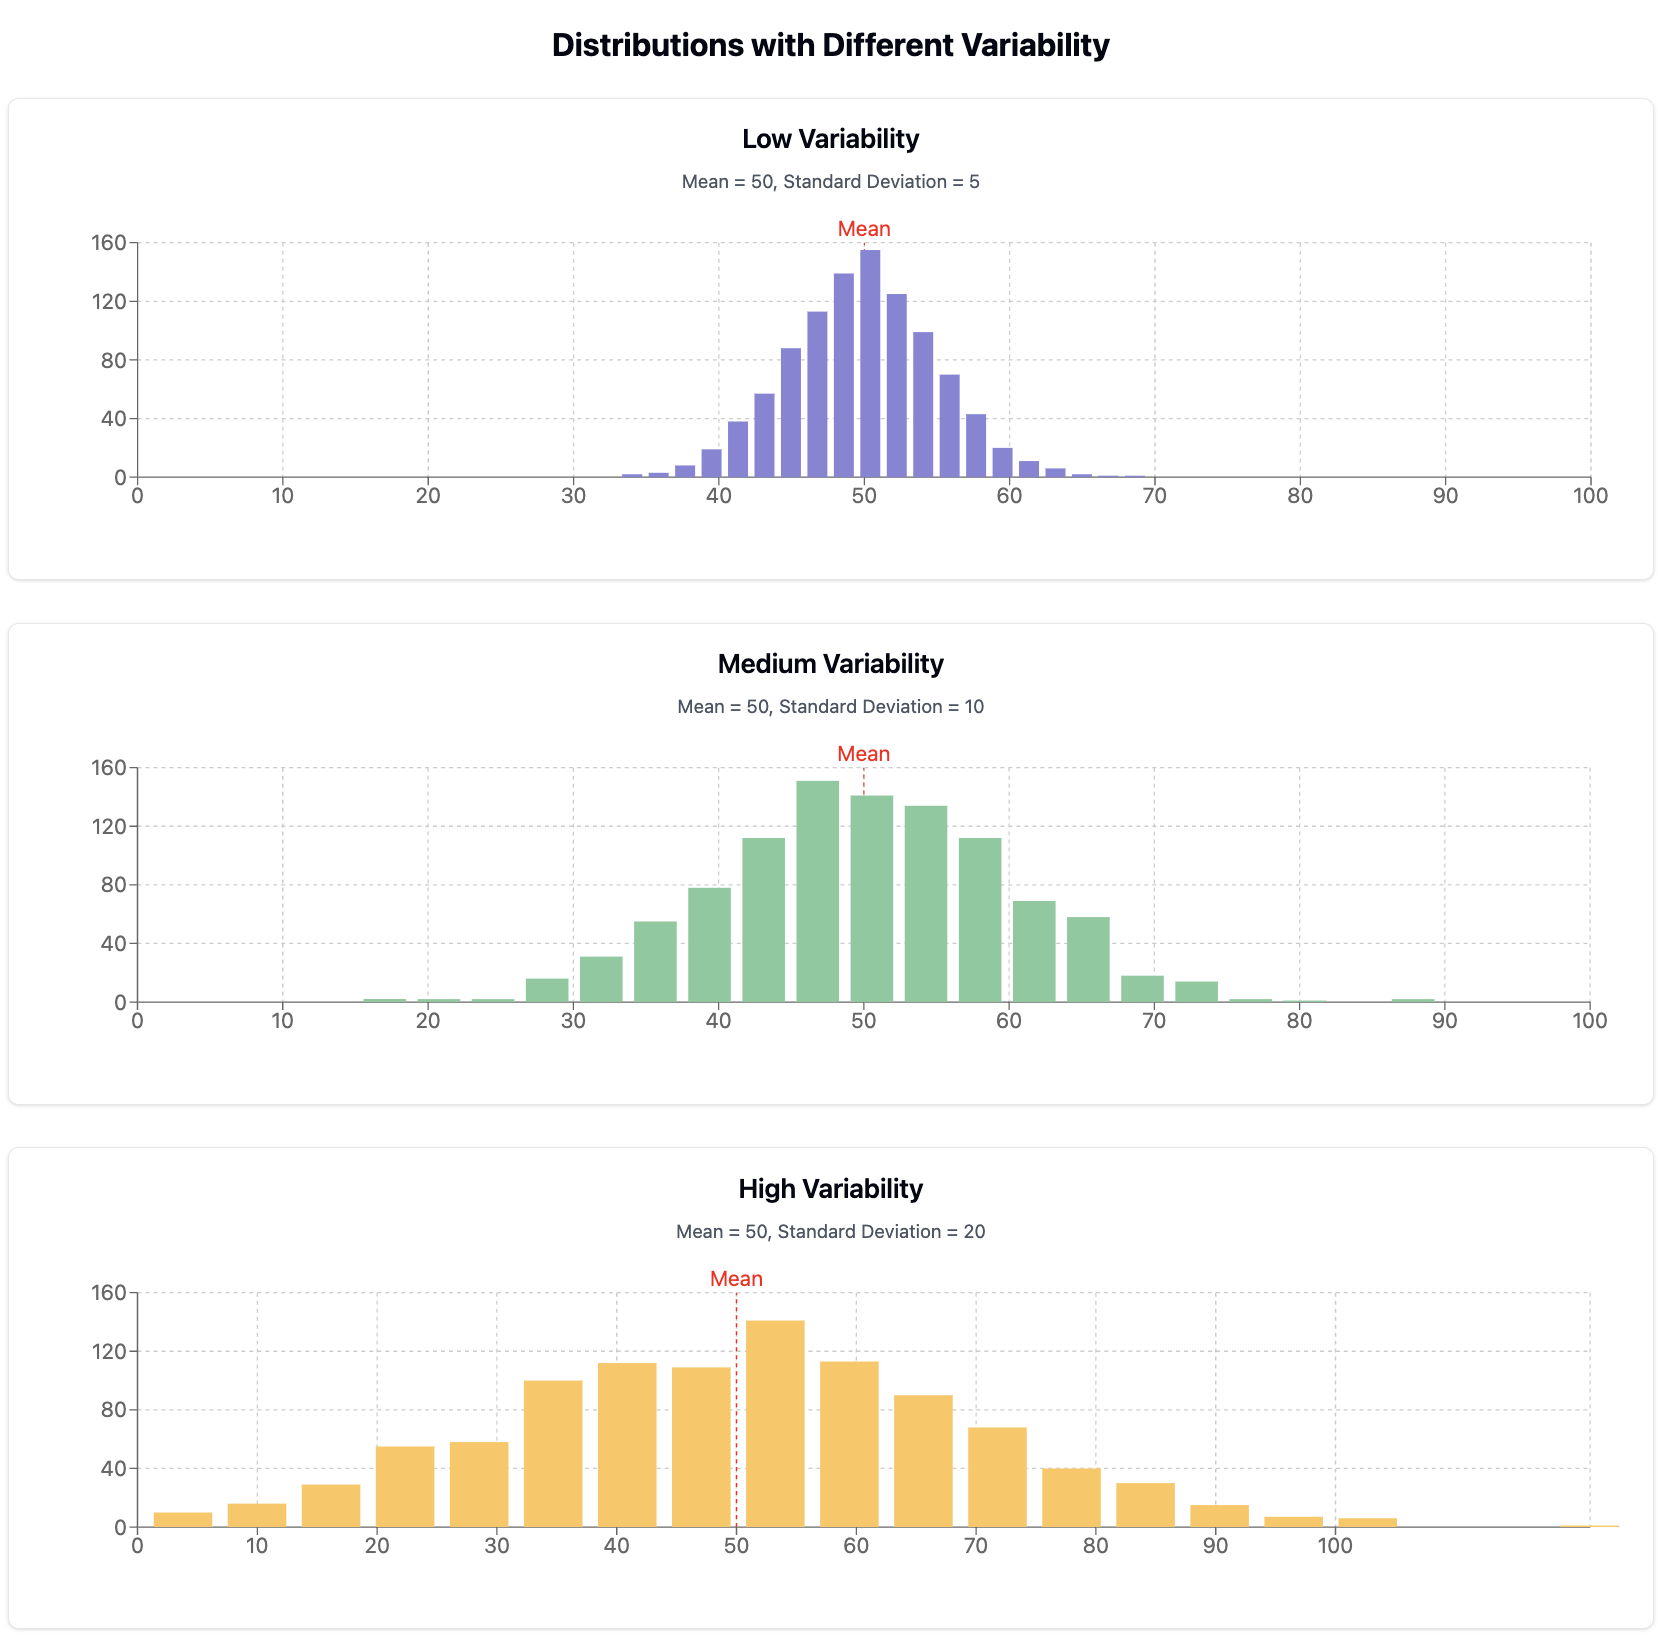
Figure44.Visualizing Variability in Distributions
Checkpoint45.Understanding Variability.
Which of the following statements about variability is TRUE?
High variability in a dataset always indicates a problem with data collection.
This is not true. High variability might be a natural characteristic of the phenomenon being studied, not necessarily an indication of problems with data collection.
The mean is always the best measure of central tendency regardless of variability.
This is not true. When data is highly skewed or contains outliers, the median may be a more appropriate measure of central tendency.
Two datasets with the same mean must have the same standard deviation.
This is not true. Datasets with the same mean can have vastly different spread or variability, resulting in different standard deviations.
Understanding variability is essential for making appropriate inferences from data.
Correct! Acknowledging and accounting for variability is a fundamental aspect of statistical thinking and is crucial for proper data interpretation.
SubsectionAccounting for Variability in Data Analysis
When conducting data investigations, we need to consider variability at every stage:
When asking questions: Formulate questions that acknowledge and explore variability
When considering data: Evaluate how sampling methods might affect variability
When analyzing data: Use appropriate visualizations and statistics to represent variability
When interpreting results: Consider how variability affects the strength and reliability of conclusions
Example46.Variability in Community Health Data.
In our Community Health dataset, we might observe that:
Asthma rates vary considerably across neighborhoods (spatial variability)
Air quality measurements fluctuate seasonally (temporal variability)
The relationship between green space and obesity is stronger in some demographic groups than others (variability in relationships)
Some health metrics have greater measurement uncertainty than others (variability due to measurement)
Acknowledging these sources of variability helps us avoid oversimplified conclusions and recognize the complexity of environmental health relationships.
Activity13.Exploring Variability in Your Dataset.
In this activity, you’ll explore sources of variability in your chosen dataset.
(a)
Identify at least three variables in your dataset and use CODAP to create visualizations showing their distributions.
(b)
For each variable, describe the pattern of variability you observe. Is the distribution symmetric, skewed, uniform, bimodal, or something else?
(c)
Consider what might cause the variability you’re seeing. Is it natural variation in the phenomenon, differences between groups, measurement issues, or something else?
Checkpoint47.Measures of Variability.
Match each statistical measure with the aspect of variability it best represents.