
Section What is Data Science?

Subsection Defining Data Science

Data science is an interdisciplinary field that combines domain knowledge, programming skills, and statistical techniques to extract meaningful insights from data. At its core, data science is about using data to answer questions, solve problems, and make decisions.
A Venn diagram showing data science as the intersection of domain expertise, mathematics/statistics, and computer science.
Software Engineering: A Practitioner’s Approach
 3 
www.researchgate.net/publication/365946272_Software_Engineering_A_Practitioner%27s_Approach_9_th_Edition#pf2
Figure 1. The Data Science Venn Diagram
The field of data science has evolved from statistics, computer science, and specific domain applications. While statisticians have been analyzing data for centuries, modern data science incorporates newer tools and techniques to handle larger, more complex datasets and to gain deeper insights into the data to solve real world problems.

Checkpoint 2. Data Science Concepts.

    Which of the following best describes data science?
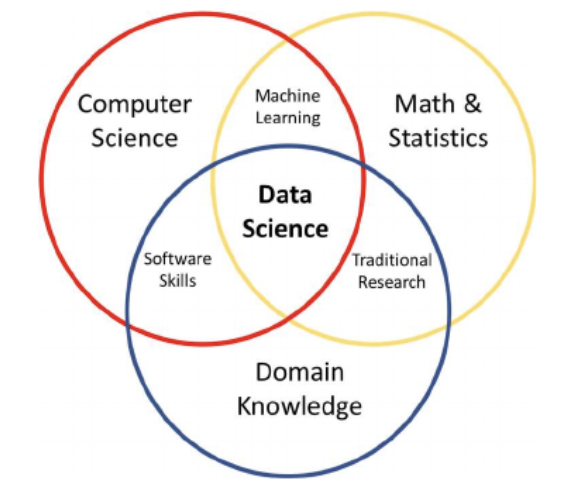
  • An interdisciplinary field that combines domain knowledge, programming skills, and statistical techniques to extract insights from data
  • Correct! Data science combines multiple disciplines to analyze and interpret data.
  • A branch of computer science focused exclusively on machine learning algorithms
  • While machine learning is part of data science, data science is broader and includes other disciplines.
  • A synonym for statistics that uses modern technology
  • Statistics is a component of data science, but data science also incorporates programming, domain expertise, and other skills.
  • The process of creating visual representations of large datasets
  • Data visualization is an important part of data science, but data science encompasses much more.

Activity 1. Exploring Data Science History: Snow’s Cholera Map.

Long before the term "data science" existed, people were using data to solve important problems. One of the most famous historical examples is Dr. John Snow’s investigation of a cholera outbreak in London in 1854.
During a severe cholera outbreak in the Soho district of London, Dr. Snow collected data on the locations of cholera deaths and plotted them on a map. By carefully mapping each case, he noticed a pattern: the deaths clustered around a specific water pump on Broad Street. This spatial analysis led him to hypothesize that contaminated water, not "bad air" (the prevailing theory at the time), was responsible for spreading the disease.
John Snow’s map showing cholera cases clustered around the Broad Street pump in London.
National Geographic
 4 
education.nationalgeographic.org/resource/mapping-a-london-epidemic/
Figure 3. John Snow’s Original Cholera Map (1854)
Snow’s methods included:
  • Data collection: Recording the locations of cholera deaths
  • Spatial analysis: Plotting cases on a map to identify patterns
  • Hypothesis testing: Testing his theory by investigating the water source
  • Intervention: Recommending the removal of the pump handle, which helped end the outbreak
This early example of data-driven decision making saved lives and helped establish the field of epidemiology.
(a)
How is Snow’s approach similar to modern data science methods? Identify at least two similarities.
(b)
What limitations did Snow face in his data collection and analysis? How might these have affected his conclusions?
(c)
If Snow had access to modern data science tools (like CODAP, GIS systems, or statistical software), how might his analysis have been enhanced or expanded?

Subsection Why Data Literacy Matters

Data literacy—the ability to read, work with, analyze, and communicate with data—has become an essential skill in the 21st century. Whether you’re making personal decisions, participating in civic discussions, or pursuing a career, understanding data helps you:
  • Make informed decisions based on evidence rather than intuition alone
  • Critically evaluate claims that others make using data
  • Communicate your own findings effectively
  • Identify misleading presentations of data
  • Understand complex systems and patterns in the world

Example 4.

Consider a news article that claims "Violent crime has surged by 30% this year." A data-literate person would ask:
  • Compared to what baseline? (Last year? Five years ago? The lowest point ever recorded?)
  • What specific crimes are included in "violent crime"?
  • What geographic area does this apply to?
  • Has the way crimes are reported or recorded changed?
  • Is a percentage the most appropriate measure, or would raw numbers provide important context?

Activity 2. Data Literacy in the News.

In this activity, we’ll practice data literacy by examining news articles.
(a)
Go to Google and navigate to the News tab. Type in Data about and enter in a topic you’re interested in. Choose an article that looks interesting to you.
(b)
Identify at least three questions you would ask to better understand the data behind the claim.
(c)
If possible, find the original data source and determine if the article’s interpretation seems accurate.

Checkpoint 5. Data Literacy Skills.

Subsection Applications of Data Science

Data science methods are transforming virtually every field:
Healthcare
  • Predicting disease outbreaks
  • Personalizing treatment plans
  • Improving diagnostic accuracy
  • Optimizing hospital operations
Business
  • Customer segmentation
  • Demand forecasting
  • Process optimization
  • Fraud detection
Environmental Science
  • Climate modeling
  • Ecosystem monitoring
  • Pollution tracking
  • Resource management
Social Sciences
  • Analyzing social networks
  • Studying behavioral patterns
  • Evaluating program effectiveness
  • Understanding demographic trends

Activity 3. Data Science in Your Field of Interest.

In this activity, you’ll explore how data science is used in a field that interests you.
(a)
Select a field or industry that interests you.
(b)
Research and identify at least three specific ways data science is being applied in this field.
(c)
For one application, describe the data that might be collected, how it might be analyzed, and what insights it provides.